Label Clusters in a Network Graph Plot
addClusterLabels.RdFunctions for labeling the clusters in network graph plots with their cluster IDs. The user can specify a cluster-level property by which to rank the clusters, labeling only those clusters above a specified rank.
Usage
labelClusters(
  net,
  plots = NULL,
  top_n_clusters = 20,
  cluster_id_col = "cluster_id",
  criterion = "node_count",
  size = 5, color = "black",
  greatest_values = TRUE
)

addClusterLabels(
  plot,
  net,
  top_n_clusters = 20,
  cluster_id_col = "cluster_id",
  criterion = "node_count",
  size = 5,
  color = "black",
  greatest_values = TRUE
)
Arguments
- net
A
listof network objects conforming to the output ofbuildRepSeqNetwork()orgenerateNetworkObjects(). See details.- plots
Specifies which plots in
net$plotsto annotate. Accepts a character vector of element names or a numeric vector of element position indices. The defaultNULLannotates all plots.- plot
A
ggraphobject containing the network graph plot.- top_n_clusters
A positive integer specifying the number of clusters to label. Those with the highest rank according to the
criterionargument will be labeled.- cluster_id_col
Specifies the column of
net$node_datacontaining the variable for cluster membership. Accepts a character string containing the column name.- criterion
Can be used to specify a cluster-level network property by which to rank the clusters. Non-default values are ignored unless
net$cluster_dataexists and corresponds to the cluster membership variable specified bycluster_id_col. Accepts a character string containing a column name ofnet$cluster_data. The property must be quantitative for the ranking to be meaningful. By default, clusters are ranked by node count, which is computed based on the cluster membership values if necessary.- size
The font size of the cluster ID labels. Passed to the
sizeargument ofgeom_node_text().- color
The color of the cluster ID labels. Passed to the
colorargument ofgeom_node_text().- greatest_values
Logical. Controls whether clusters are ranked according to the greatest or least values of the property specified by the
criterionargument. IfTRUE, clusters with greater values will be ranked above those with lower values, thereby receiving a higher priority to be labeled.
Details
The list net must contain the named elements
igraph (of class igraph),
adjacency_matrix (a matrix or
dgCMatrix encoding edge connections),
and node_data (a data.frame containing node metadata),
all corresponding to the same network. The lists returned by
buildRepSeqNetwork() and
generateNetworkObjects()
are examples of valid inputs for the net argument.
Value
labelClusters() returns a copy of net with the specified plots
annotated.
addClusterLabels() returns an annotated copy of plot.
References
Hai Yang, Jason Cham, Brian Neal, Zenghua Fan, Tao He and Li Zhang. (2023). NAIR: Network Analysis of Immune Repertoire. Frontiers in Immunology, vol. 14. doi: 10.3389/fimmu.2023.1181825
Author
Brian Neal (Brian.Neal@ucsf.edu)
Examples
set.seed(42)
toy_data <- simulateToyData()
network <- buildRepSeqNetwork(
toy_data, "CloneSeq",
cluster_stats = TRUE,
color_nodes_by = "cluster_id",
color_scheme = "turbo",
color_legend = FALSE,
plot_title = NULL,
plot_subtitle = NULL,
size_nodes_by = 1
)
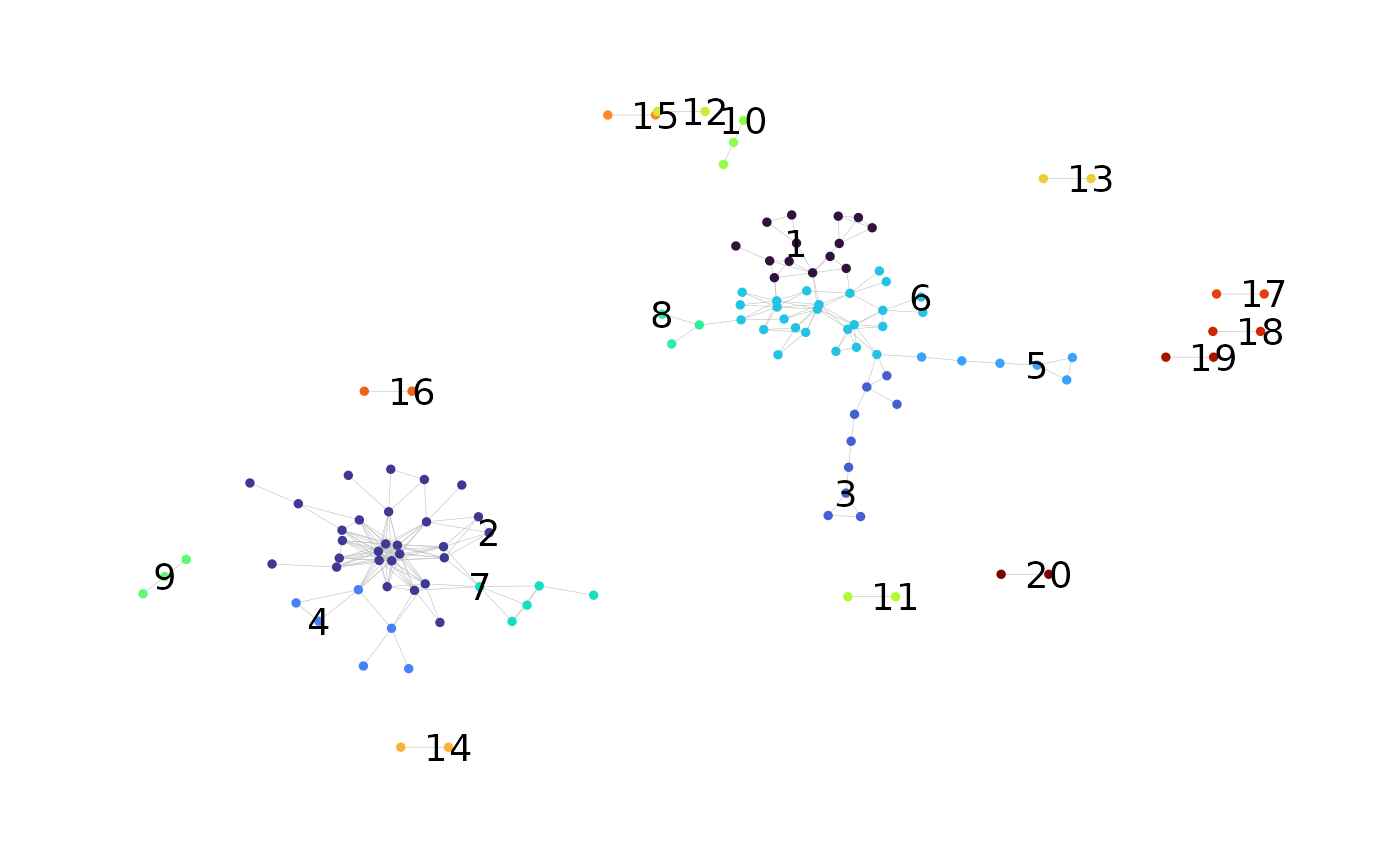
network <- labelClusters(network)
network$plots$cluster_id
#> Warning: Removed 102 rows containing missing values or values outside the scale range
#> (`geom_text()`).