Label Nodes in a Network Graph Plot
addGraphLabels.RdFunctions for annotating a graph plot to add custom labels to the nodes.
Usage
labelNodes(
  net,
  node_labels,
  plots = NULL,
  size = 5,
  color = "black"
)

addGraphLabels(
  plot,
  node_labels,
  size = 5,
  color = "black"
)
Arguments
- net
A
listof network objects conforming to the output ofbuildRepSeqNetwork()orgenerateNetworkObjects(). See details.- plot
A
ggraphobject containing the network graph plot.- node_labels
A vector containing the node labels, where each entry is the label for a single node. The length should match the number of nodes in the plot.
- plots
Specifies which plots in
net$plotsto annotate. Accepts a character vector of element names or a numeric vector of element position indices. The defaultNULLannotates all plots.- size
The font size of the node labels. Passed to the
sizeargument ofgeom_node_text().- color
The color of the node labels. Passed to the
sizeargument ofgeom_node_text().
Details
The list net must contain the named elements
igraph (of class igraph),
adjacency_matrix (a matrix or
dgCMatrix encoding edge connections),
and node_data (a data.frame containing node metadata),
all corresponding to the same network. The lists returned by
buildRepSeqNetwork() and
generateNetworkObjects()
are examples of valid inputs for the net argument.
Labels are added using
geom_node_text().
Value
labelNodes() returns a copy of net with the specified plots
annotated.
addGraphLabels() returns
a ggraph object containing the original plot annotated
with the node labels.
References
Hai Yang, Jason Cham, Brian Neal, Zenghua Fan, Tao He and Li Zhang. (2023). NAIR: Network Analysis of Immune Repertoire. Frontiers in Immunology, vol. 14. doi: 10.3389/fimmu.2023.1181825
Author
Brian Neal (Brian.Neal@ucsf.edu)
Examples
set.seed(42)
toy_data <-
simulateToyData(
samples = 1,
sample_size = 10,
prefix_length = 1
)
# Generate network
network <-
buildNet(
toy_data,
seq_col = "CloneSeq",
plot_title = NULL,
plot_subtitle = NULL
)
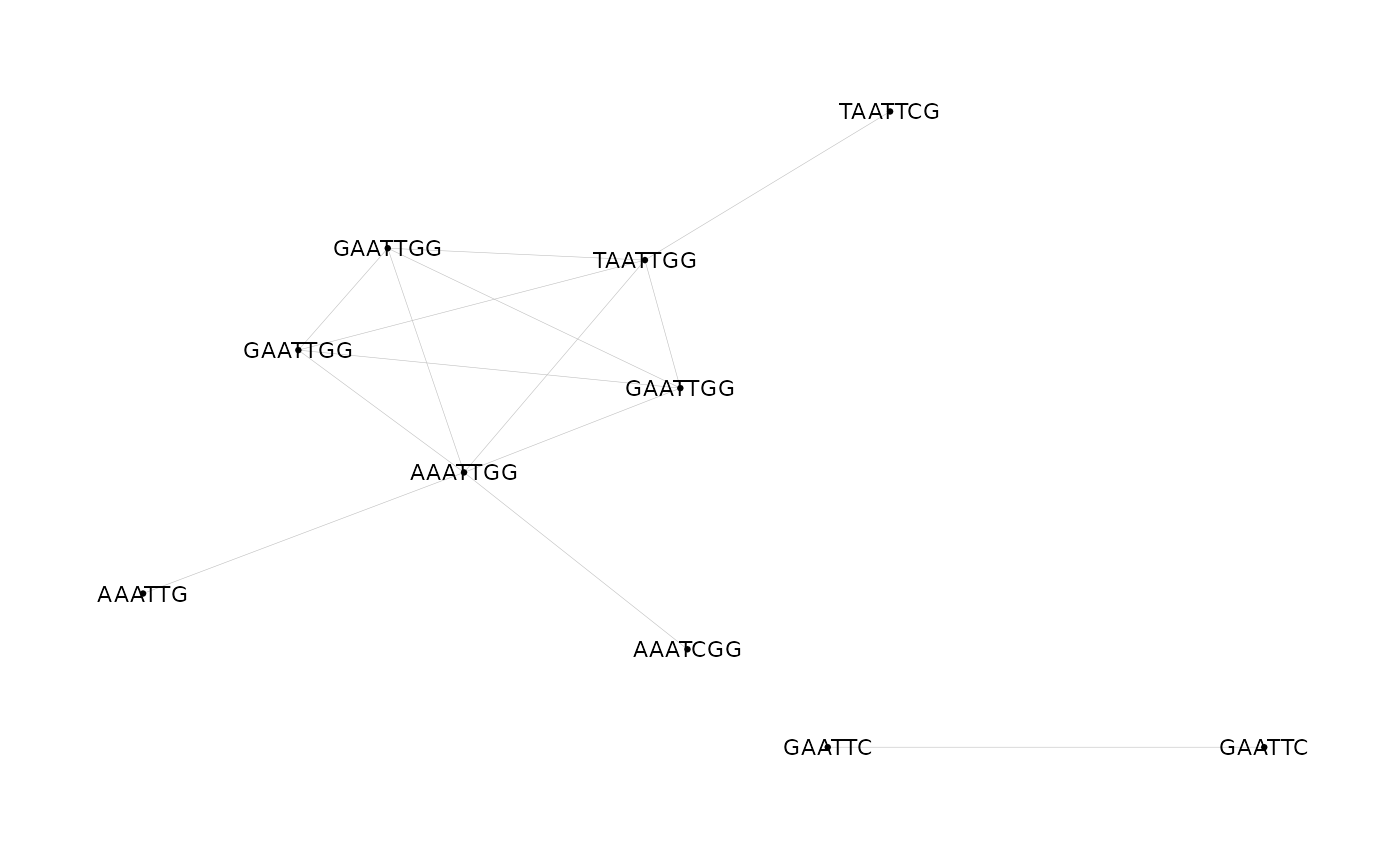
# Label each node with its receptor sequence
network <- labelNodes(network, "CloneSeq", size = 3)
network$plots[[1]]