Write Plots to a PDF
saveNetworkPlots.RdGiven a list of plots, write all plots to a single pdf file containing one plot per page, and optionally save the graph layout as a csv file.
Usage
saveNetworkPlots(
  plotlist,
  outfile,
  pdf_width = 12,
  pdf_height = 10,
  outfile_layout = NULL,
  verbose = FALSE
)
Arguments
- plotlist
A named list whose elements are of class
ggraph. May also contain an element namedgraph_layoutwith the matrix specifying the graph layout.- outfile
A
connectionor a character string containing the file path used to save the pdf.- pdf_width
Sets the page width. Passed to the
widthargument ofpdf().- pdf_height
Sets the page height. Passed to the
heightargument ofpdf().- outfile_layout
An optional
connectionor file path for saving the graph layout. Passed to thefileargument ofwrite(), which is called withncolumns = 2.- verbose
Logical. If
TRUE, generates messages about the tasks performed and their progress, as well as relevant properties of intermediate outputs. Messages are sent tostderr().
References
Hai Yang, Jason Cham, Brian Neal, Zenghua Fan, Tao He and Li Zhang. (2023). NAIR: Network Analysis of Immune Repertoire. Frontiers in Immunology, vol. 14. doi: 10.3389/fimmu.2023.1181825
Author
Brian Neal (Brian.Neal@ucsf.edu)
Examples
set.seed(42)
toy_data <- simulateToyData()

net <-
  generateNetworkObjects(
    toy_data,
    "CloneSeq"
  )

net <-
  addPlots(
    net,
    color_nodes_by =
      c("SampleID", "CloneCount"),
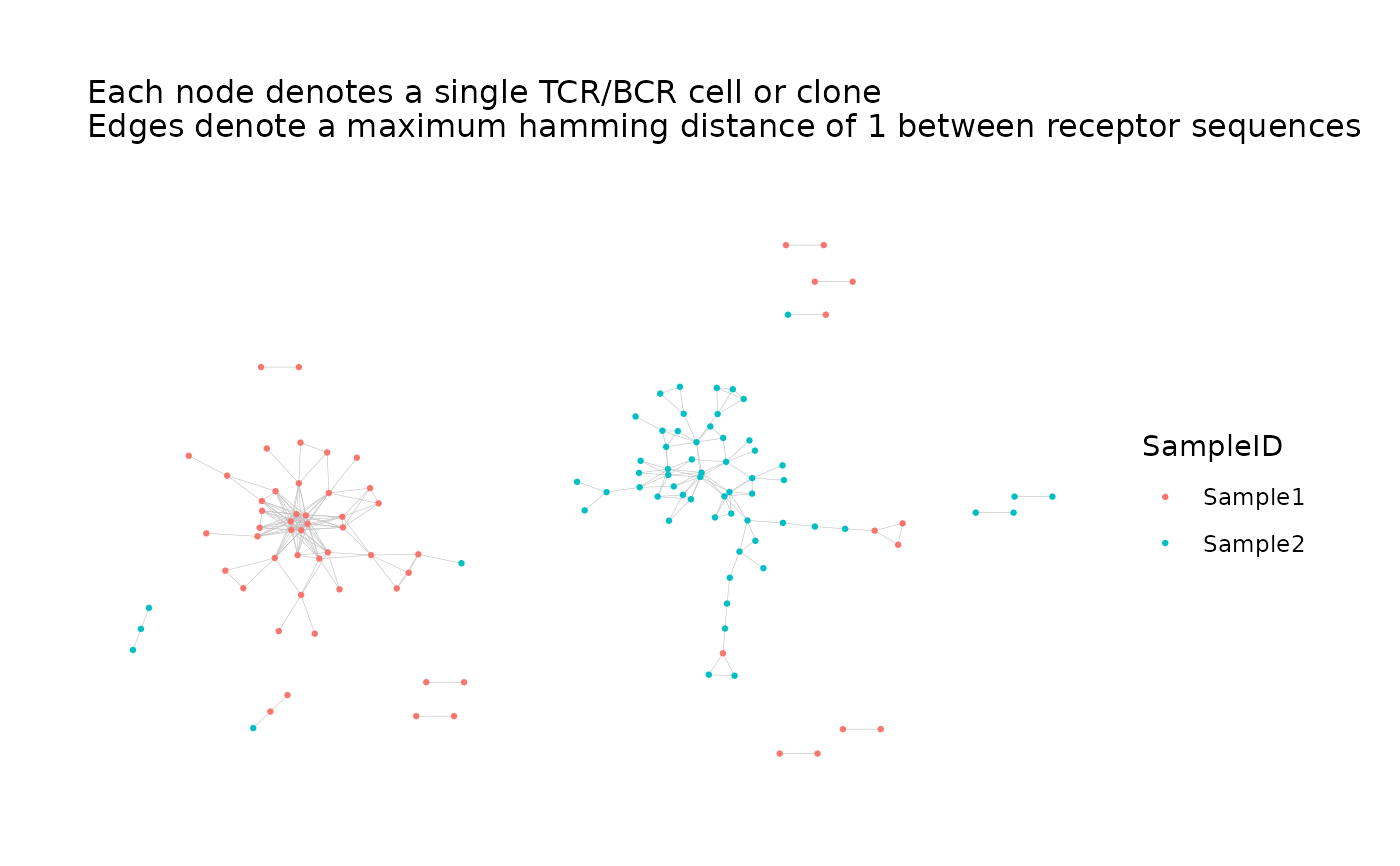
    print_plots = TRUE
  )


saveNetworkPlots(
  net$plots,
  outfile =
    file.path(tempdir(), "network.pdf"),
  outfile_layout =
    file.path(tempdir(), "graph_layout.txt")
)

# Load saved graph layout
graph_layout <- matrix(
  scan(file.path(tempdir(), "graph_layout.txt"), quiet = TRUE),
  ncol = 2
)
all.equal(graph_layout, net$plots$graph_layout)
#> [1] "Mean relative difference: 8.87687e-08"